
Point at the bug. Send the fleet the evidence.
Scout is the Chrome extension for turning any web app you are looking at into a Port Daddy visual task. It captures a screenshot, optional rectangle, and DOM clues when the page allows it, then opens a reviewable issue in your local daemon.
Browser evidence in, reviewable work out.
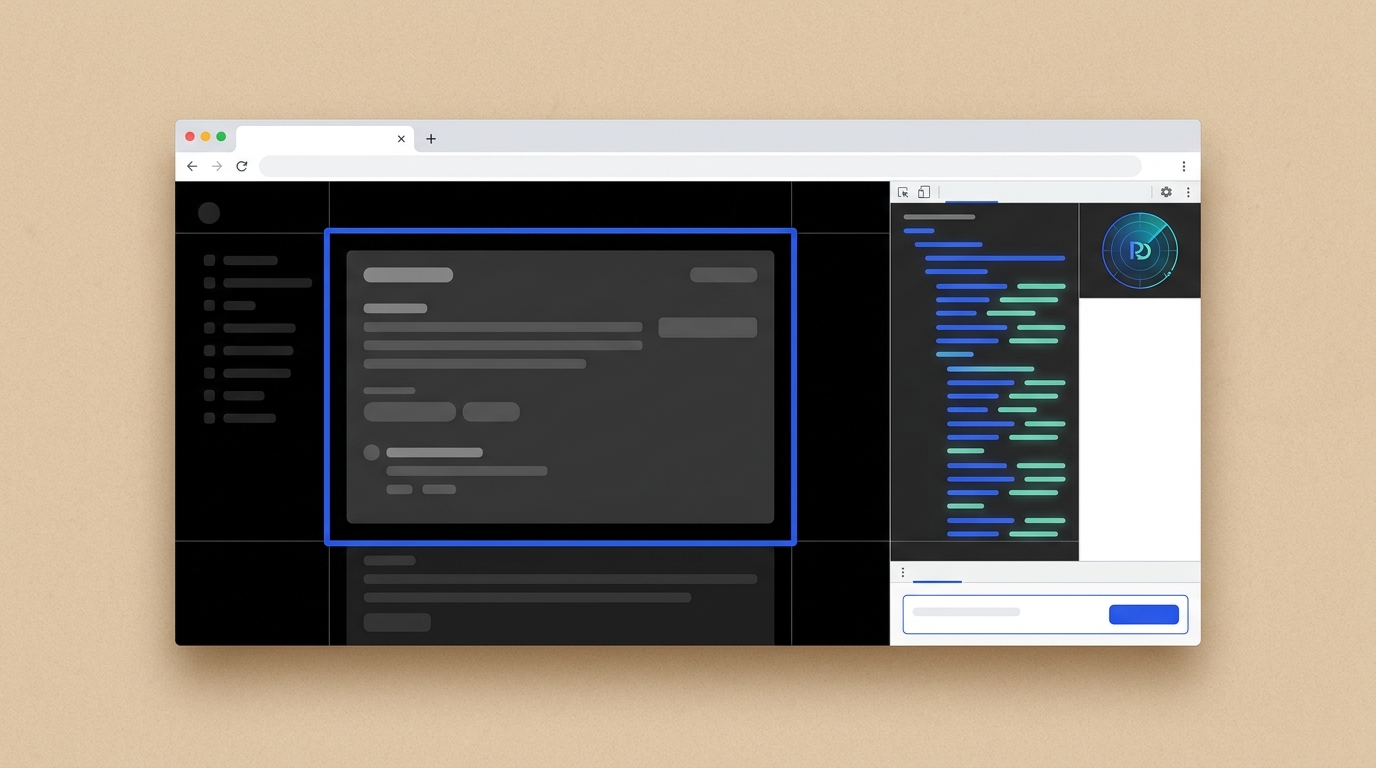

The difference between a screenshot and a task.
A picture is enough for a human to remember the complaint. Scout adds the machine-readable context a spawned run can actually use.
Visible tab
Capture the exact browser view, URL, title, viewport, and page metadata.
Draw a region
Select the part of the page that is wrong, then send only that rectangle with the screenshot.
DOM context
On project pages, Scout samples selectors, XPath, text, bounds, and React debug source hints when available.
The issue lands in Port Daddy, not in another forgotten tab.
The extension posts one visual-task envelope to the daemon. Port Daddy stores the image, records the context, and can route it to the review queue or spawn work when the backend is configured.
One envelope, one place to inspect it.
Open a Port Daddy visual issue in the local daemon.
Attach the screenshot through the daemon blob store.
Publish the envelope on the visual-feedback channel.
Optionally ask Port Daddy to spawn work for the task.
Load it today. Do not pretend this is the final install.
The preview is real local plumbing: Chrome loads Scout from this checkout, Scout talks to your daemon, and the daemon opens the visual task. The real customer install is a Chrome Web Store release, described below.
Install Port Daddy and start the local daemon
Scout talks to the daemon on your machine. If the local control plane is not running, capture still looks nice but cannot open a Port Daddy issue.
git clone https://github.com/curiositech/port-daddy.gitcd port-daddypd setuppd status
Load the checkout as a Chrome preview
This is Chrome Developer Mode, not the product distribution path. Load the folder directly while Scout is still in preview.
apps/pd-scout-extension
Capture any normal web page
Open a page, click Port Daddy Scout, capture the page or draw a region, write the brief, and open the issue.
Daemon URL: http://127.0.0.1:9876
Where the folder goes, for now.
Open chrome://extensions, enable Developer mode, click Load unpacked, and choose apps/pd-scout-extension. The popup defaults to http://127.0.0.1:9876.
The grown-up install is the Chrome Web Store.
Chrome already has the distribution machinery we need: signed delivery, review, listing assets, privacy fields, and automatic updates. Scout should graduate through that path, not a README full of ritual.
Package the extension
Create a ZIP from the extension directory after the manifest, icons, popup, background service worker, and content script are all versioned.
cd apps/pd-scout-extensionzip -r ../../dist/pd-scout-preview.zip . -x '*.DS_Store'
Upload it to Chrome
Use the Chrome Web Store Developer Dashboard to upload the ZIP, then complete Store Listing, Privacy, Distribution, and Test instructions.
Developer Dashboard -> Add new item -> Choose file -> Upload
Submit, then update by version
Submit for review. For each update, bump manifest.version, upload a fresh ZIP with all extension files, and submit that version for review.
manifest.version: 0.1.1 -> upload new ZIP -> submit for review
What still has to be true before public install.
A ZIP build step in CI, with only extension files included.
Final store copy, at least one real 1280 x 800 screenshot, and the promo tiles already in assets/store.
Privacy fields that say exactly what Scout captures: screenshot, URL, optional rectangle, and DOM hints.
A small trusted-tester rollout before the public listing goes live.
A browser extension needs a face.
Scout is branded as a Port Daddy intake surface, not a loose utility. The extension includes the manifest icons Chrome uses in the toolbar and the starter graphic assets needed for a future Web Store listing.
Manifest-ready now, store-ready starter kit next.
Chrome toolbar icons: 16, 32, 48, and 128 px.
Source Scout mark: Port Daddy glyph plus region-selection brackets.
Chrome Web Store starter assets: 128 px store icon, 440 x 280 promo tile, 1400 x 560 marquee tile, and 1280 x 800 screenshot.
Yes, with the right expectations.
Scout works as a local developer-mode Chrome extension in this branch. The honest caveat is distribution: signed, auto-updating Chrome packaging is future work.
Works now
Unpacked Manifest V3 Chrome extension.
Visible-tab screenshots through chrome.tabs.captureVisibleTab.
Shadow-DOM region picker on ordinary web pages.
Composer reopens after region selection with a captured badge and rectangle preview.
Project picker populated from the local daemon.
DOM selector, XPath, text, bounds, viewport, and URL capture.
Blob-first screenshot upload plus POST /visual-tasks in the local daemon.
Playwright repro for rectangle capture, DOM context, and visual-task payload shape.
Not yet
No Chrome Web Store listing submitted yet.
Browser-restricted pages such as chrome:// cannot be captured.
Third-party sites provide DOM hints, not source-code ownership.
Cloud fleet routing depends on the configured Port Daddy backend; the local path is what works in this branch.
The rectangle flow is scriptable.
The repro loads Scout in Playwright Chromium, serves a fixture page, draws a rectangle, checks the page highlight and reopened composer, then submits to a mock daemon.
node apps/pd-scout-extension/tests/scout-region-repro.mjs
The browser becomes another Port Daddy intake surface.
Use Scout for UI bugs, copy nits, layout regressions, and “this thing right here” feedback on any ordinary web app. Project pages get better DOM evidence; outside sites still get screenshot evidence and a durable issue.